COVID19 India Growth Analysis
Started this article as a periodic report and my analysis of COVID-19 in India. I chose to focus on the rate of growth with daily resolution deeming it to a key indicator of progression and control; having observed the trends of some of the countries which are closer to recovery. Daily growth rate is nothing but new cases being reported in relation to the existing number of cases.
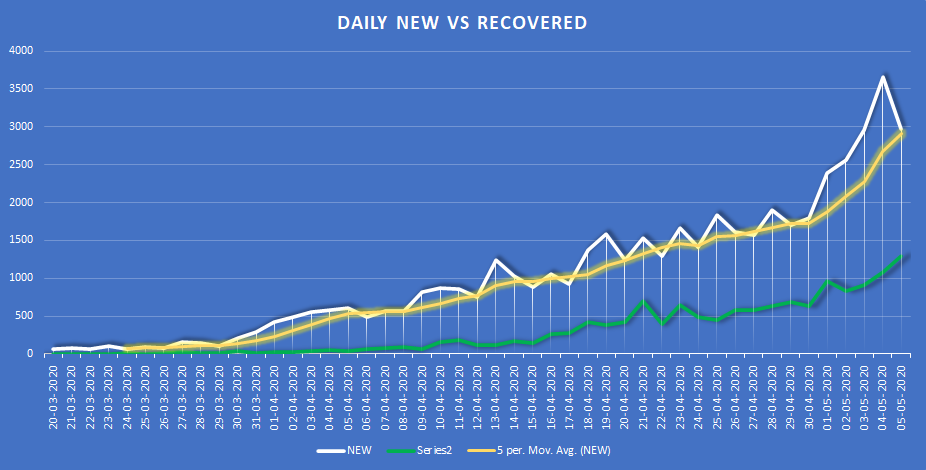
Updated Live Dashboards are not available at https://www.setia.in/covid19. This include charts depicting Total cases in India along with 5-Day Moving Average of Confirmed Cases Growth Rate. Also includes chart for depicting number of new cases being reported in India daily with its moving average. This can act as an indicator of COVID-19’s R-0 number in India. This also helps see notice trends around specific events and changes. The other line reports daily recoveries in India.
Analysis & opinions
(reverse chronological order)
12-Jun - Over time, the awareness of how the Coronavirus has grown and is spreading has increased and sufficient media coverage and data access is available for everyone therefore, I am pausing this periodic coverage however, the live dashboard will continue to exist.
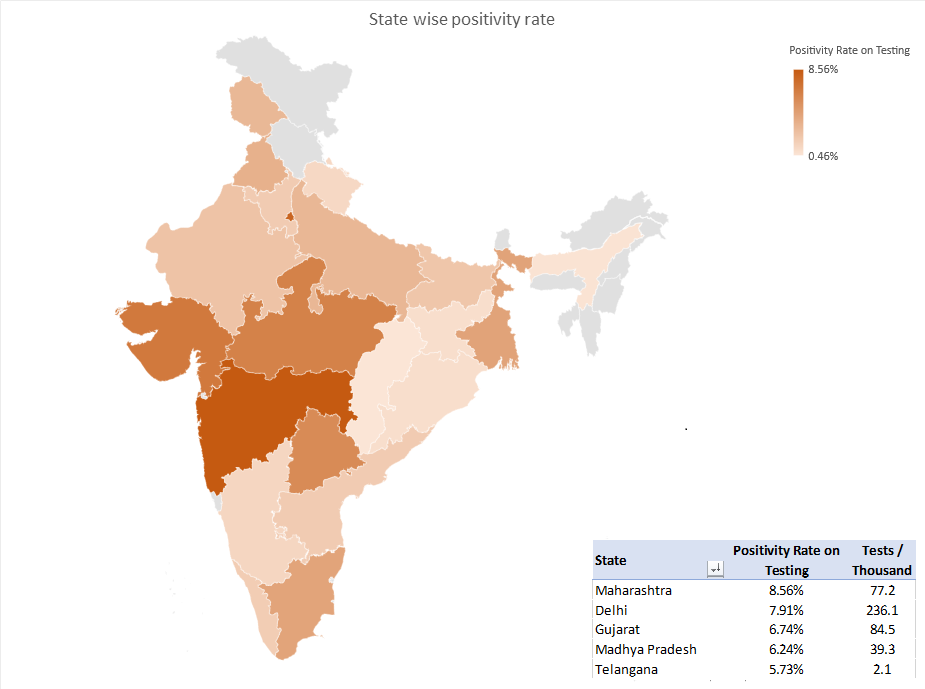
6-Jun – A view of statewise test positivity rate for all states with populations in excess of 1 crore. Delhi and the central west generally has higher than 5% positive returns on tests. One thing that differentiates Maharashtra is that its positivity rate is gradually increasing implying the virus is spreading.
**24-May - We seem set to report more than 7000 new cases today. As of now, we stand 10th worldwide in terms of Total Reported Cases and 5th worldwide in terms of Current Active cases.
We are currently in our 2nd wave of growth in the last month. We saw a surge in growth rate at the turn of the month which started to go down after a week and we have observed a similar surge over the last week. I do not expect this one to go down soon though as we have just exited our Lock Down 3 a week ago therefore, social contact has surely increased which will result in higher replicate rate which should be visible from within 2-3 days.
We did slow the growth speed of COVID19 in India however, for some reason, our preventative efforts proved ineffective to entirely get rid of it. While other countries did respond well to lockdowns and showed drop in number of new cases reported, we have had our issues because of a number of societal and logistical reasons. Therefore, I believe we will see India go well past a million cases – in fact, I won’t be surprised if we get to 5 million confirmed cases. The downside it that this will take time and we have to live in the current way for this while.
13-May – While we are looking to go past 1 lac confirmed cases in the next 5-6 days, there is some silver lining.
Over the last week or so, some states have actually started showing downwards trends or no further increase in their Total Active cases. This list includes some states with high case counts as well – Delhi, Gujarat, UP, Punjab, W. Bengal & Andhra Pradesh.
Another important thing is Maharashtra has shown signs of slowing the transmission with fewer new cases being reported than the previous day for a couple of days before today had a slight jump.
This has overall resulted in the drop in the daily growth rate of confirmed and active cases with the latter hovering just under 5% again – right where it was a couple of weeks ago before it jumped up.
I would expect it to hold steady here as some states are now starting to gain momentum – as far as disease spread is concerned.
5-May – What was a gradual reduction in growth rate has been abruptly broken by a steep increase in cases as well as daily growth of cases. Last 7 days have changed the direction of the curve upwards and severely dented India’s chances of arresting COVID-19 within the lock down period.
3-May – Nanded gurudwara related movement has propelled the numbers in quite a few states. Last three days have really shown a take off of the new cases and for the first time the trends of growth rate have started to go upwards as well. At this trend, we will hit a 100k cases for sure and not too far in the future.
With lockdown relaxing starting tomorrow, we should expect the numbers go pick up faster than they are currently, visibly in a week or so.
30-April – We looked pretty good about a week ago to peak soon and start to reduce the active case count however, two things have prevented it.
- We were reducing our growth rate of new cases rapidly however quite a few states which were showing a plateau in active cases have started to show increased counts now which has kept the new cases growing at 5-6 percent daily still
- The recoveries counts haven’t grown and we have had similar number of recoveries for the last 7-8 days. This will need to outgrow the new cases for active cases to start dropping
26-April – With active cases gone past 20k, we are still growing in new cases and active cases. Delhi saw a jump of 293 new cases being reported in a day after having a steady few days. This was essentially due to higher number of reports coming through of test that were pending therefore, we noticed a drop in test pending number from ~3700 to ~2500.
25-April – Interestingly, we have had a alternate day jumps in the new cases being reported and only time it holds together is for the weekend. Therefore for last two weeks, we have had these jumps on Tuesdays, Thursdays, Saturdays & Sundays. I wonder why that is. Could be something to do with how many cases on a day prevents the health infrastructure capacity to process all of the available potential cases the next day. Weekend does allow that capacity because of perhaps absence of some other distractions (with respect to COVID-19).
Maharashtra, Gujarat & UP continue to be the key states reporting most of the cases and Bihar is on its way to be in the list soon with massive growth rates every day.
24-April – Slowly however steadily we are making progress. Our Confirmed case daily growth rate was 6.1% yesterday and that of Active cases was 5% . Average Growth rate for the last 5 days for Active cases has been 5.5% down from 11% it was 2 weeks ago i.e. our active cases are growing at half the rate they were growing 2 weeks ago. This is because we have had a lot more recoveries in these two weeks and new cases growth has also dropped from an average of 12% daily growth 2 weeks ago to average 7% daily growth now.
23-April – While the daily new cases growth rate is fluctuation in the 6-8 percent range, the 5-day moving average for the same is every so slightly dropping, currently at 6.8% for confirmed cases. The same for active cases is 5.6%. We hit our peak and bend the active cases curve downwards when the active cases growth rate goes down to 0% and negative percentages from there on. At current incline, it will take another 2 weeks for it to get there (which means my prediction of early-May peak will slip by 4-5 days).
The biggest contributor to today’s new cases was Maharashtra with almost half of the country’s cases being report there. However, it is also the state with the highest number of tests being carried out so its a sign of how many unreported cases are spread across the country that can only surface when our testing capacity increases.
22-April – We observed the lowest daily growth rate of confirmed cases since March 15 and grew at 6.4%. While Maharashtra, Rajasthan & Gujarat continue to be the focus area, Uttar Pradesh & Bihar seem to be emerging as newly affected regions.
21-April – A month ago we had 400 cases and we have grown 50 times in a month. With the lock down, we did slow down the growth of the virus in our country however it may seem we aren’t at the point yet where we can comfortably anticipate our peak number and period by which we will have managed it. That’s because the new cases numbers seem to be growing steadily. However keep in mind, with recoveries catching up with the new cases numbers, the curve will start to bend. Its already at 40% of new cases. Moreover, the cases surfacing now are focused in a region and not widespread. Other regions have started to show signs of recovering from their respective peaks i.e. Kerala, Delhi & Tamil Nadu and others like Karnataka & Rajasthan are looking like having gone past their peak as well. I believe we only need 3 big states to turn around their story and we will see a overall change therefore, I will still stick with my earlier prediction of hitting peak towards the end of April, +/- 4 days.
20-April – Kerala being the leader having successfully gone past its peak, other states (>100 confirmed cases) which saw a reduction in active cases today include Delhi, Tamil Nadu, Haryana & J&K – the first two in the list having been in the top of the charts is sign of good things to come I guess. We only need similar improvement from the western regions of the country now. Here is the new cases chart with a 5-day moving average introduced there as well.
19-April – Last couple of days have really dented our chances to recover from this pandemic within the stipulated lock down period as we have added close to 3k new cases within these two days, mostly from states which weren’t reporting too many cases earlier. The phenomenon is clear in the daily new cases chart as well as the daily growth rate chart. The new cases curve was all but steady and seem to start falling after April 13 however last two days have changed how the trend looks and it does look scary because it is projecting a steady linear growth. Same linear growth rate i.e. same as previous days is visible in the daily growth rate chart as well.
This was a declining trend earlier and is a key indicator whether or not our lock down is being effective. My initial thoughts were that this is due to citizens not taking the lock down seriously since the finishing stages of the first phase lock down and into the second phase of lock down and leverages are being taken which has led to infection spreading easily. However, I think its because of the increase in testing and we are discovering cases now for people without symptoms who wouldn’t otherwise know to report it. In my opinion, the likely cause for these cases could be the migrant labor taking it from the cities to other regions of the country. I believe this because the states reporting fresh cases are the ones that supply daily wage migrant labor to Delhi & Mumbai and are close enough for the migrant labor to consider walking back or taking a bus back. In such case, my expectation is that we are in for a surge for the next week or so. Lets brace for it. The moving average of daily growth rate that was steadily falling has also seen no change from yesterday hovering at 6.5%.
18-April – Alright, so this new case count and growth rate is slightly fluctuating and makes it difficult to visualize the actual trend. Govt has started sharing trends with weeks as resolution. I have decided to use moving average growth rate over last 5 days as an indicator which does the same job, just more frequently. This clearly shows the steadily reducing growth of new cases. We had 1371 new cases – the most we have had any day so far. This was at a growth rate of 7% over previous day. We also had the most recoveries we had so far @ 426 and 35 people lost their lives. The ratio of new cases to new recoveries today was 3.2:1. This ratio will be important in coming days; the lower it goes the more the active case curve will bend. Eventually we want it to reverse where more recoveries happen than new cases reported and the active case count will start to go down.
17-April – We added another 920 cases today however, we had 273 recoveries which topped yesterday’s 259 therefore a net addition of ~600 cases to the active count. The new case curve is really starting to take a settled shape and you can still feel it increasing although a couple of day of drop in the new case count might make it look like past its peak. Lets watch out for it.
For the first time, we had a single-digit growth for two days in succession. However, our rate of growth hasn’t dropped as dramatically as that of S. Korea. I will attribute that to the population density and the sheer size of our country. It does that quite an effort on the government’s end to be able to manage a big population like ours – keeping them home, keeping them fed and keeping them sane. I’d say we are 10 days away from the point when the new case percentage will be in the 2-3% range and perhaps stay there.
16-April – Another day went by today which added another 1062 cases to the confirmed count which grew @ 9%. Good news is that the recovery count has started to pick up and for the first time we had more than 200 people recover – 259 to be exact. It does seem to be taking longer for us to reduce the growth rate.
The way this is going for us, we are still on our way up and assuming we hit our peak in next 10-12 days, we will hit a Total Active count around 16.5k-18k and we would have taken 5 weeks to get there from 1000 cases therefore, based on the precedents from other countries that suggest that the active cases curve is very symmetrical i.e. it takes the same amount of time for the active cases to reduce as it did to build up, it will take us till the end of May to get to under a 1000 cases therefore, that’s the time frame we should be looking at till when most of the major cities will be under a lock down. Here is the Total Active count curve plotted with the Total Confirmed count till date.
15-April – As I expected, we are back to the growth rates of single digits as we added 882 new cases today and took the confirmed total to over 12k with the growth rate of 8%. The fall in growth rate isn’t as steep as that of South Korea however, its trending down for sure. From the two daily new cases trends I presented a couple of days ago, the better one seems to be the one thats holding.
14-April – With addition of another 1033 confirmed cases today, our total confirmed case count stands at 11,487 today and the daily growth rate was 10% which is very close to what it was two days ago therefore, the rationale for sudden jump yesterday being a one-off case is justified. It is further confirmed in the fact that only 51 more cases were added from Delhi today which has already starting random testing via the SHIELD program in selected localities. Lets just look forward to this dropping down to 5% levels in a week or so as the general trend line is heading downwards for the last 3-4 weeks.**
The daily new cases trend line, which had a stead look till about a week ago has been fluctuating quite a bit however holding a trend which seems to be straightening. Lets hope for it to bend further for this is what is needed for the active case count to even start bending. We also had 163 cases recover today and our total active cases count stands at 9733 and its surely going past 10000 today so expect some fireworks on news media. 🙂
13-April – We went past 10,000 confirmed cases today with more than a thousand cases added on a day for the first time. I did expect the 800-1000 range to hold for a few days and I did also expect a one-time jump from Delhi due to the untested bunch so here we are growing at 13% including the 356 confirmed cases from Delhi, much of whom should be the result of those related to Tablighi Jamaat expecting their test report today. Need to appreciate how the public authorities have contained the damage this could have caused.
And here is your daily dose of daily growth rate chart. I got a chance to compare our growth rate with that of South Korea which has successfully countered COVID-19 in their country. What I’ve come to find is that their growth rate was higher than ours to begin with however they got it down to 5-6% and then its been steady in 2% range. Their initial high growth rate is understandable due to their strategy being testing driven and not that of containment by locking themselves down. The same cannot be done in India because of the size of the country and its population. Here is a depiction from the day both countries had around 400 cases reported.
My biggest take-way from this was we aren’t too far away from it and we might see a dip in our growth rate to 6 percent within a week and then its all downhill from there.
12-April – Alright, thankfully the new cases reported number today continued to fall as did the growth rate for another day in succession. We had 758 new cases reported today taking the overall reported tally to 9212 and overall active cases count to 7783. The daily growth rate fell to 9%. I believe we should see the daily growth rate holding at 9s and 10s for the coming few days except the untested Tablighi Jamaat related cases who are already isolated. Those might show up as a aberration on any of these days or spread across. Good news is that we had high number of cases reported starting 1-April, a lot of whom will not recover as its close to two week so we should see a steady increase in recovery count soon therefore the active cases curve should start to bend.
The new cases curve also looks good however, I expect it to hold close to this range (750-1000) for the coming 3-4 days before we see any drastic drop in the new cases reported count. I also expect us to go past 10k confirmed cases tomorrow.
11-April – To my relief, the peak I was expecting seem to have been avoided. We added another 854 new cases today and took the overall 8454 with daily growth rate of 11%. Its been like that last 5 days therefore, we have taken 6 days to double our confirmed case count. On the other hand, we had around 180 people recover today which is starting to pick up as percentage of the confirmed cases reported on the day. It was earlier in 10% range and now stepping up to mid 20s. What this means is that our net addition to active cases is dropping slowing and our active case curve should start to bend soon.
My theory yesterday on how it was a break in reporting looks to be incorrect currently.
10-April – With 871 new cases reported today @ a growth rate of 13% over yesterday’s total confirmed count, our total confirmed count as reached 7600. I believe we should be over 10k in a couple of days as its the same 10-day cycle when the growth rate wave hits the top. I am still not sure why that’s happening though.
However, I believe it when I look at the new case curve as it seems that something administrative or procedural prevented the cases to be reported over last couple days and the break in the daily numbers has been compensated for in a single day and the new cases growth is back on track as marked with the red line in the chart below.
9-April – The fall has finally broken with more than 800 new cases reported today. The growth rate picked up a little to 14% over the previous day’s total. However what’s making me anxious is that this day seem to have appeared completely out of the blue where a positive trend was surfacing. More then 25% of these have been reported in Maharashtra which could be a result of relatively wider testing being carried out there. What this day has done is made the last few days look like a pause in terms of the new cases reported and thats the reason I started monitoring daily growth rate to begin with – to prevent days like these to overwhelm us.
8-April – And the trend continues to flatten bit-by-bit. Growth rate of daily new cases is steady at 11-12% range last 3 days. Therefore, the new case curve is flattening.
For active cases count to flatten and dip, new cases need to dip a little more and the recovered number have to pick up enough to be in similar range as the new case count everyday. Current, its still higher double digits however being close to a week and half from when the cases picked up, we will see a pick up in recovery count soon therefore, we should see a flattening of the active cases curve in the next 4-5 days.
7-April – Relatively the same kind of growth as previous day and the daily new case count was back to to 500s, 573 to be precise. Like I thought yesterday, 6-Apr was an aberration of sorts it might take a couple of days yet for the new cases to start reducing. Maharashtra has gone past a thousand cases in the state and is still at high risk with few cases being reported from Dharavi with really high population density.
Meanwhile, Covid19india.org has published some new dashboards on the demographic and deep dive pages and I will encourage you to check those out to understand the impact better. One of the things that surfaces is that the infection seems to be impacting men more than women.
6-April – First time since 29-March, the number of fresh cases reported was less than the previous day therefore we had a further dip in the daily growth rate down to 11%.
As I thought yesterday, we might hit the peak daily new case count in a couple of days. This chart suggest we might have already done it however, I will give it a couple of days still to be sure this wasn’t just an aberration. Lets hope this dips further next few days and then we can start seeing the active cases going down.
5-April – With 605 more fresh cases, we stand at nearly 4300 confirmed cases and little under 4000 active cases. Good news is the daily growth rate has dipped further down, in line with my expectation, to 16%.
I believe our focus will soon shift from the daily growth rate to daily fresh case absolute numbers as we might be very close to hitting the peak post which we should be on our way down in terms of the number of fresh cases we are identifying every day. I think we should be hitting the peak in next 2-3 days after which we start to go down. Going by trends of countries who’ve been through this stage, the growth rate drop after the peak was very sudden therefore, I would expect the downwards slope to take us below 100 fresh cases within 7-8 days of the day we are past the peak. Lets see if my prediction holds.
I think we should extend the lock down until we are able to bring these numbers down to a manageable levels, even with the fresh revelation made regarding the disease not being airborne but only transferring through droplets on surfaces.
4-April – We added 563 more confirmed cases yesterday which is exactly the same number we added day before. The growth rate has obviously dipped a little more down to 18% which is great news. It does seem like this peak was really an effect of the Nizamuddin based religious event and even with that, it does seem that Govt. of India decisiveness has resulted in curbing the virus well. Lets hope for this trend to continue in next week.
Our overall fatalities of the pandemic stand at 99 now which means 99 families have lost a dear one. New case curve shows a very satisfying right turn, at least at present. I really hope we can curb this and bring this down while the recovered count starts to increase.
3-April – Having added another 563 fresh cases yesterday, the overall confirmed count has gone past 3000. However, continuing the previous day’s trend, the growth rate has dipped another 2%. I have a very positive feeling about how we have gotten past this peak. The next possible peak is very close to the day when currently planned lock out finishes so I hope it does get extended by a week and this growth rate dips down to 10s soon.
2-April – So we added another 486 new people to our confirmed case count yesterday, of course, the biggest number so far however, the growth rate dipped every so slightly to 24%. Like I’ve been saying this was expected give the number of people in a confined space being infected in a religious facility in Delhi. If this is per my theory of a peak in growth every 10 days and its heading back down, we should be happy that this peak was lower than the previous two peaks on 9-March and 20-March.
With respect to the absolute new case trend line, for the first time in last few days, it seems to be curving right.
1-April – Single biggest jump in confirmed cases with growth of over 26% over the previous day. We have gone past 2000 confirmed cases and the new cases curve really seems to have taken off. In fact, we have doubled our confirmed cases within 4 days whereas Italy has done the same in 11 days in the same period which implies the growth in Italy is slowing down, partially due to a higher percentage of their population already been impacted relative to India.
There seems to be a sine curve in this trend line where the growth picks up every 10 days or so. I have two theories about why this could happen. First theory is that of our complacency once the growth rate drops a couple days and fewer fresh cases get reported converting into more people stepping out. Second theory is that the number of average days for symptoms to appear is around 5-7 days therefore which each growth wave, there are contacts who surface in the next wave. I will work on analyzing whether the second theory has any merit in the data available.
The number of confirmed cases directly or indirectly related to the religious event in Nizamuddin area, Delhi is 237 and I believe there are still a lot more from that event who were tested and may turn up positive between today and tomorrow. Lets hope that number is as less as possible.
31-March – With hot spots identified, it seems we have hit the point where the infection seems to be taking off which is really bad news. As of now, India is displaying the fastest growing confirmed count in its continent. Our growth rate over previous is back up to 21%. The next 3-5 days are critical to find out whether the situation gets out of hands like in some western countries or whether we have discipline and coordination between the public services and citizens to arrest it.
At this point the new cases curve looks really scary.
30-March – First time during this period, we had a day with more than 200 fresh cases reported and the growth rate was 18% over the current confirmed count. Delhi has take another jump and expect it to increase further in a day or two as it was reported that 300 people from a masjid in Nizamuddin are showing symptoms after an event a week ago and are being tested.
29-March – It was a better day than the last couple days this Sunday as the number of new cases reported was fewer than the previous couple days @ 110 – almost a quarter of them in Delhi which I believe might be an entirely new cluster somewhere in the city. The national daily growth rate dropped to 11% curbing the growth to become exponential yet. We did lose 3 souls to COVID-19 yesterday; at the same time we did have 17 recoveries.
My biggest fear is the 10s of 1000s of daily wage workers who gathered at Anand Vihar ISBT and other border transport points who may potentially be carrying the infection into untouched rural areas which should be apparent in the next couple of weeks.
Watch this space for more.
28-March – At home in India, our numbers have just gone past 1000 yesterday and it stood at 1026. The rate of growth of infection was hovering in the high 20s (percent growth) till the Janta Curfew is in the steady 18-24% range since.
If we were to look only at the new cases being added everyday, that would be a scary picture (see below) but the above graph clearly shows that the Lock down has had a positive effect already and doing it right can further control the damage.
- Since we hard a handful cases in February, I decided to ignore that period in this analysis.
** After introduction of South Korea data comparison, I have focused on depicting growth rate trend line from the point we had 400 cases as the curves for both countries before that were wayward due to the smaller numbers and did not provide insightful information.
*** Source: https://www.covid19india.org/